In today’s complex healthcare environment, financial success depends on more than just accurate billing—it requires proactive monitoring of the revenue cycle. For compliance and operations teams, the ability to see performance metrics in real time and respond quickly to red flags is the difference between preventing revenue leakage and reacting too late. Proactive dashboards and key performance indicators (KPIs) are essential tools that transform audit data into actionable insights, enabling healthcare organizations to improve compliance, reduce denials, and safeguard revenue integrity.
Why Dashboards and KPIs Matter
Traditional revenue cycle management often relies on retrospective reports—by the time issues are discovered, denials have mounted and financial impact has already taken hold. Proactive dashboards shift this dynamic. They allow teams to:
-
Monitor performance in real time
-
Identify negative trends before they escalate
-
Align clinical, compliance, and financial stakeholders with shared metrics
-
Correlate audit findings with financial outcomes
By moving from reactive reporting to proactive monitoring, organizations create a culture of accountability where every team understands the drivers of financial health.
Core KPIs for Revenue Cycle Monitoring
While every organization may emphasize different metrics, there are several KPIs that should form the foundation of any revenue cycle dashboard:
-
Audit Completion Rate – Measures how quickly and consistently internal audits are completed. A lag in completion signals potential resource or process bottlenecks.
-
Denial Rate Trends – Tracks the percentage of claims denied and categorizes them by reason. Monitoring this metric helps teams spot recurring issues, whether coding errors, insufficient documentation, or payer policy changes.
-
Appeal Success Rate – Measures the effectiveness of the appeals process. A low success rate may indicate insufficient supporting documentation or a need for better denial management workflows.
-
Coding Accuracy Rate – Identifies the frequency of errors detected in audits. Improved accuracy correlates directly with reduced denials and fewer compliance risks.
-
Average Days in Accounts Receivable (A/R) – A financial KPI that highlights how quickly claims are being paid. Long A/R cycles often reveal inefficiencies in billing or payer response.
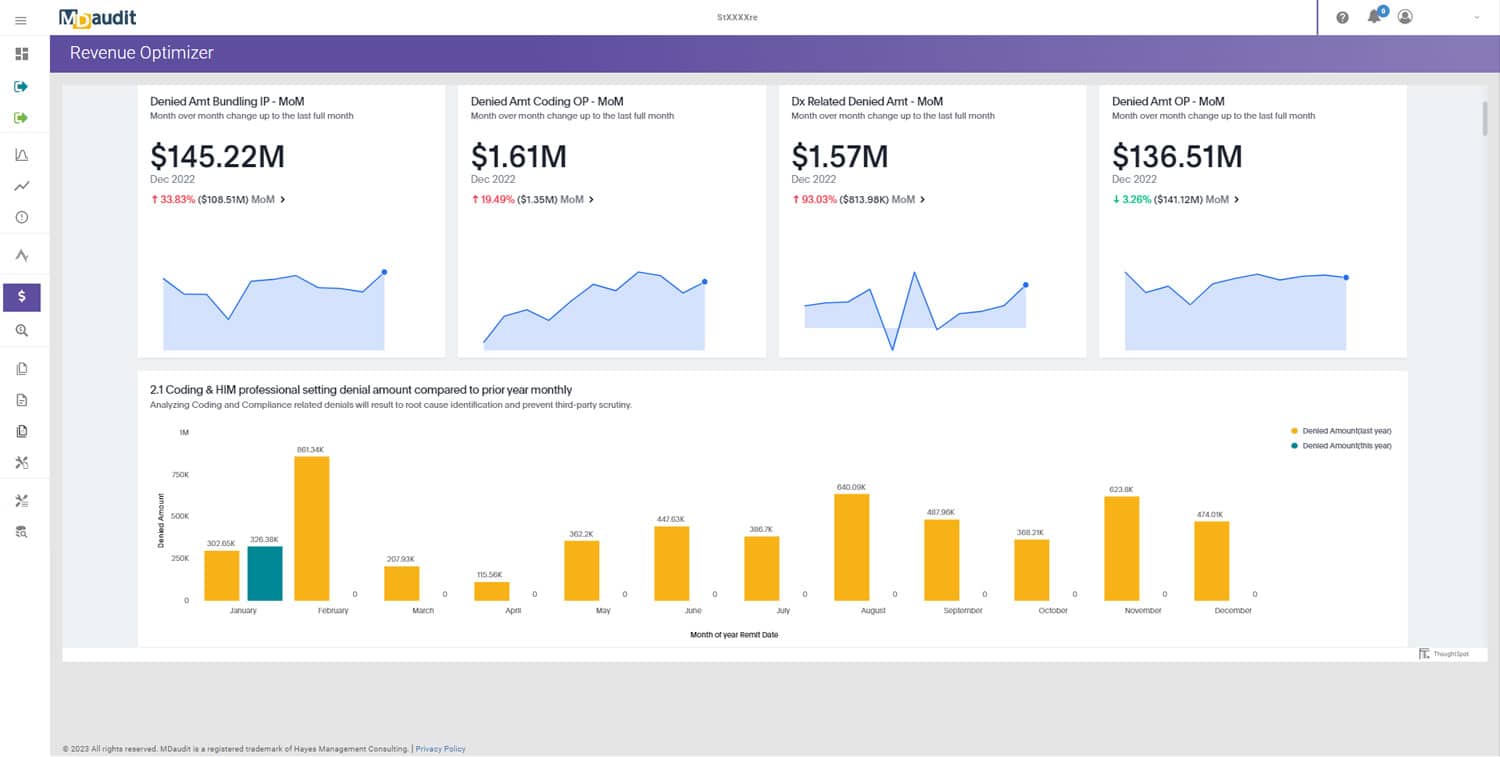
Sample Dashboard Configurations
A well-designed dashboard should combine both compliance and financial KPIs to give leaders a holistic view of performance. Examples include:
-
Compliance & Audit Dashboard: Displays audit completion rate, error categories, coding accuracy, and the percentage of high-risk cases flagged.
-
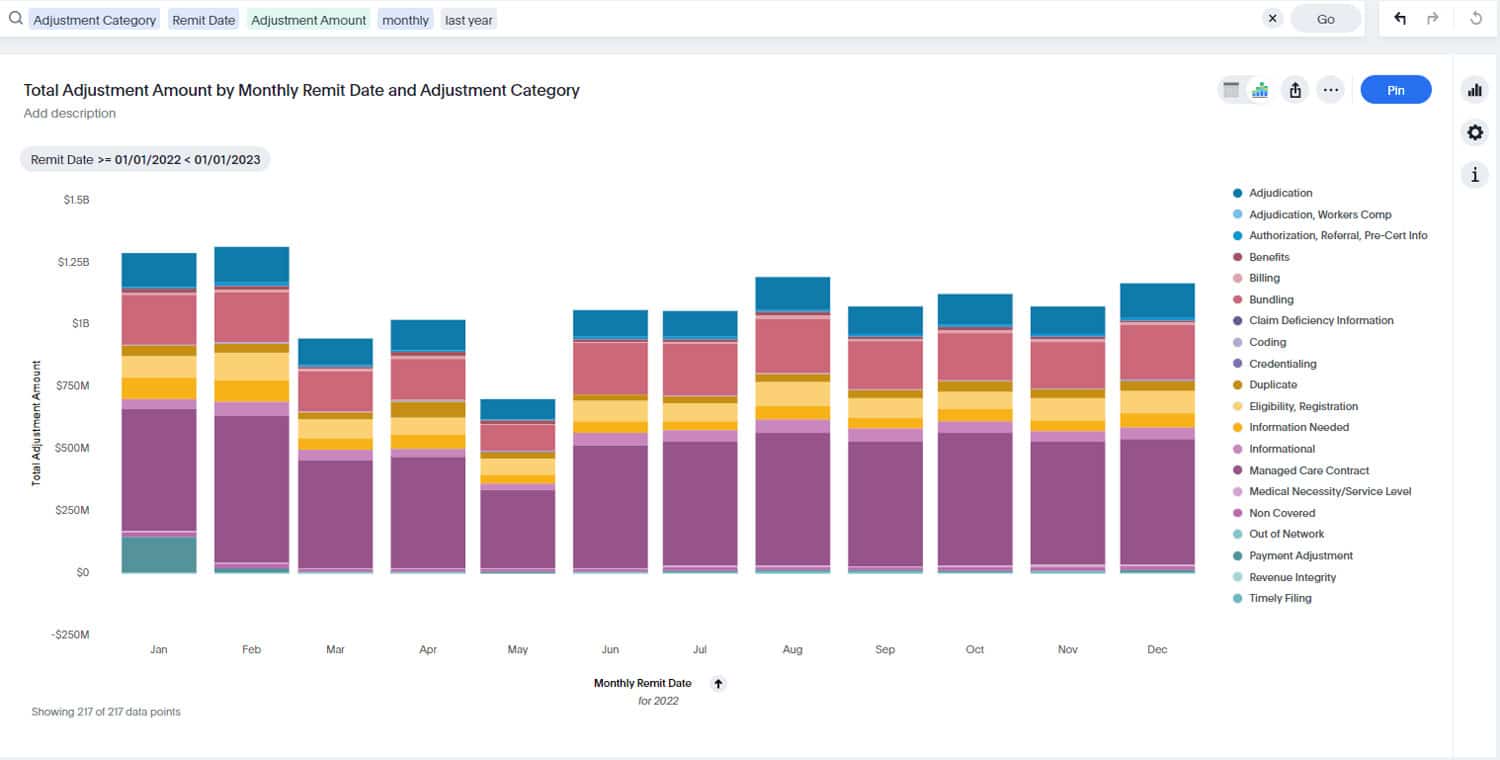
Denials Management Dashboard: Breaks down denial rates by payer, denial reason, and provider, with trending graphs that forecast future risk areas.
-
Financial Impact Dashboard: Links audit findings to dollar values—highlighting the financial impact of recurring errors, denied claims, and appeal outcomes.
By layering these dashboards, organizations can track issues from identification (audit finding) through resolution (denial management) and quantify the bottom-line impact.
Turning Insights into Action
Dashboards and KPIs only create value if they are tied to action. Organizations should:
-
Set Escalation Thresholds – Define triggers (e.g., denial rates rising above 10%) that alert leaders to intervene immediately.
-
Align Teams Around Metrics – Ensure compliance, billing, and clinical teams are monitoring the same KPIs to avoid siloed responses.
-
Benchmark Performance – Compare results internally across departments and externally against industry standards to identify gaps.
-
Close the Loop – Use dashboard data to guide training, refine coding practices, and adjust workflows—ensuring that issues uncovered by audits are fully resolved.
The Bottom-Line Impact
When dashboards and KPIs are fully integrated into audit and compliance workflows, the impact is measurable:
-
Fewer Denials – Root causes of errors are addressed before they affect claims.
-
Faster Revenue Recovery – Escalation thresholds reduce time-to-resolution for denied claims.
-
Improved Compliance – Coding accuracy improves, reducing the risk of penalties.
-
Greater Financial Clarity – CFOs and revenue leaders gain clear, real-time visibility into the health of the revenue cycle.
Conclusion
Revenue cycle monitoring is no longer a back-office function—it’s a strategic imperative. By implementing proactive dashboards and KPI-driven insights, healthcare organizations can transform audit findings into real financial improvements. The result is not just stronger compliance, but a healthier bottom line.